
Water resources from snow
Melt water is the end product of excess energy input into the snow cover. It can be heat from the air, solar radiation or longwave radiation from the atmosphere and clouds. By estimating accurately the energy balance over a snow covered catchment, we can forecast precisely the amount of water generated in the coming days. That is the task of a sophisticated model, SnowDEM (Snow Distributed Energy balance Model)
SnowDEM
SnowDEm is a numerical model developed by Corripio (2003, 2004) which makes a detailed evaluation of all the energy fluxes to the snow pack at a catchment scale. It deals with topography at a very high resolution, and therefore it is suitable for application to mountain areas. It can be combined with high resolution outputs from regional weather models, providing an excellent forecasting tool.
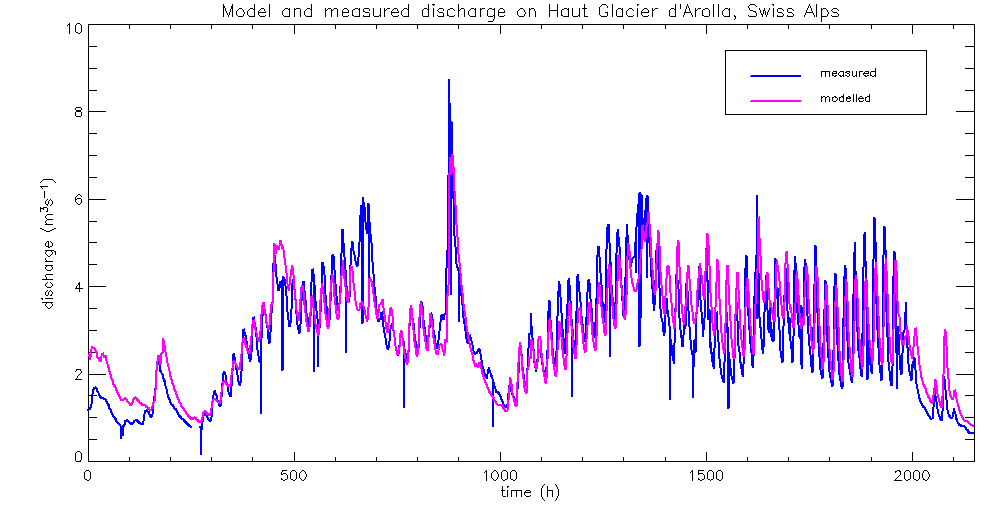
The ability to evaluate water production is highlighted in the next figure, which shows the comparison between modelled and measured water discharge at hourly intervals:
|
|
|
Figure 1.- Modelled (purple) and measured (blue) discharge at hourly intervals during three summer months on a glacier in the Swiss Alps. The measuring station is the water intake for the Grande Dixence hydropower plant. |
The model is designed to produce graphical outputs at selected time steps, so that its performance can be monitored at every moment, as shown in the animation below. It can incorporate data from direct observations (automatic weather stations) or derived from regional weather forecast models. It also uses surface images (see section on surface monitoring) either as data input or for testing and validation.
|
|
|
Figure 2.- Animation of the SnowDEM graphic outputs for a 2 day simulation of the energy balance and melt water production of an Alpine Catchment. |
Some of the model outputs can be seen in the following animation of snow cover change, and new snowfalls in the higher peaks. These images were compared with observation and maps derived from the surface photographic monitoring with excellent results.
|
|
|
Figur3 2.- Evolution of the snow cover on a glacier in the Swiss Alps, during two summer months. As the snow melts the tongue is visible on the northern side. Reflectivity gets smaller as snow ages, becoming more grey in the image, until a snow fall apperas, first on the higher peaks, sometimes over the whole catchment. Note how toward the end of the period the model is able to catch the effect of some medial morraines on snow melt, by the left side of the middle tongue. |
Coupled snow model atmospheric model
In order to estimate water runoff and snow melt in the coming days, we couple a numerical weather forecasts with the snow energy balance. The most uncertain variable in weather forecasts is the amount of precipitation, but the WRF-ARW model do a very good job at estimating this:
Precipitation forecast
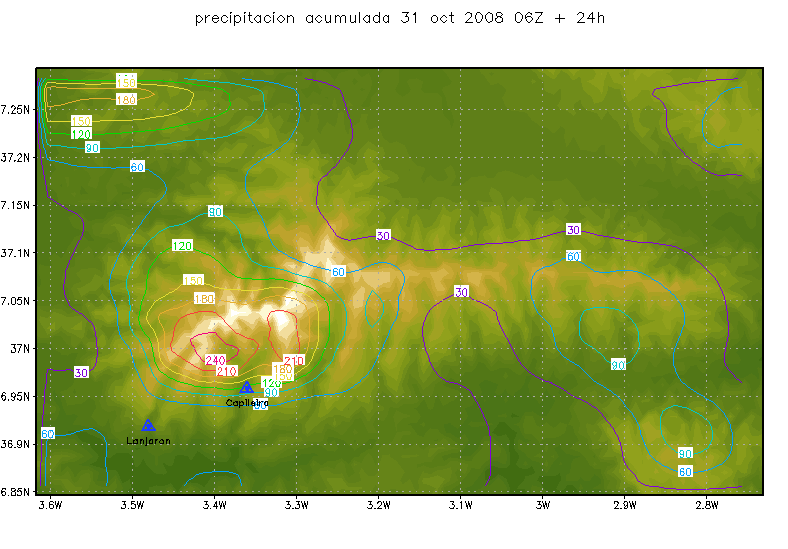
The ability of the atmospheric model WRF to replicate precipitation on mountain terrain is shown in the results of a WRF-ARW simulation for the Sierra Nevada mountains in south-eastern Spain. Nested WRF, ARW core to a resolution of 2km.
 |
|
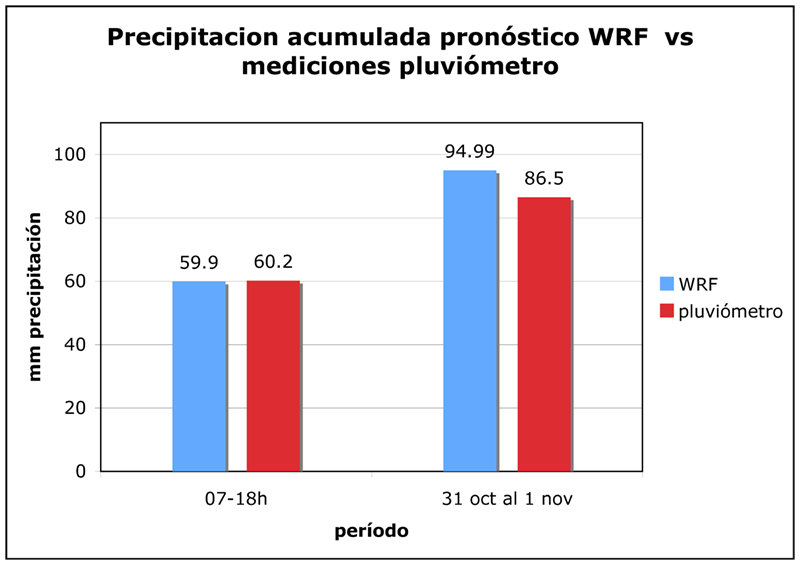
Figure 4.- Precipitation contours (mm/m2) over a relief map of the Sierra Nevada for a strong precipitation event in October-November. The location of peak precipitation was confirmed qualitatively by local observations. Highest surface elevation is 3482 m a.s.l. in the Mulhacén peak, 37.0533, -3.31139. |
 |
|
Figure 5.- Comparison between modelled and measured precipitation at the Capilera site, shown by a blue triangle in the previous map. The charts are part of a report to the Sierra Nevada National park, within a project for evaluating water resources from snow in the region. |