Conecting to database...


Energy production is estimated assuming all generators are working. If anyone is switched off, values can differ considerably. As a result wind correlation is usually better than energy correlation. Simulation could be improved if information on operative generators were available.
Select initial date:
Conecting to database...
Conecting to database...
Energy production is estimated assuming all generators are working. If anyone is switched off, values can differ considerably. As a result wind correlation is usually better than energy correlation. Simulation could be improved if information on operative generators were available.
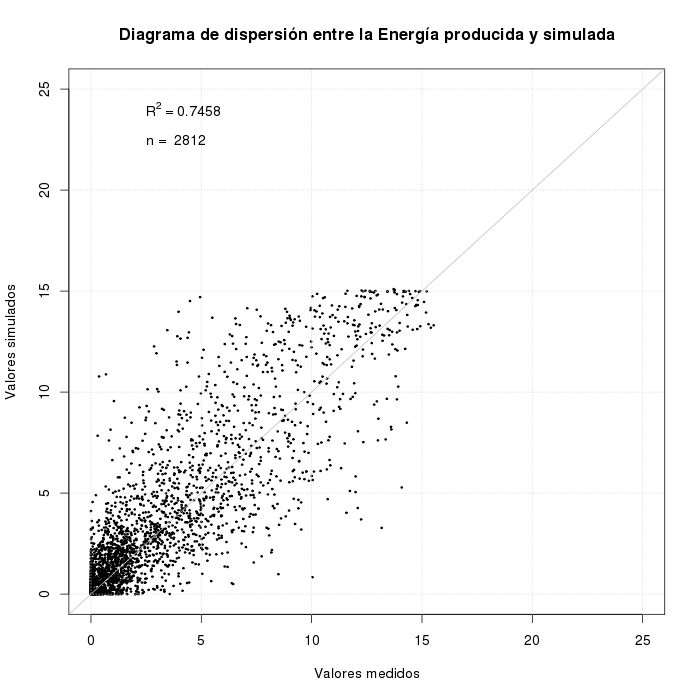 Scatterplot between measured and simulated hourly energy generation. |
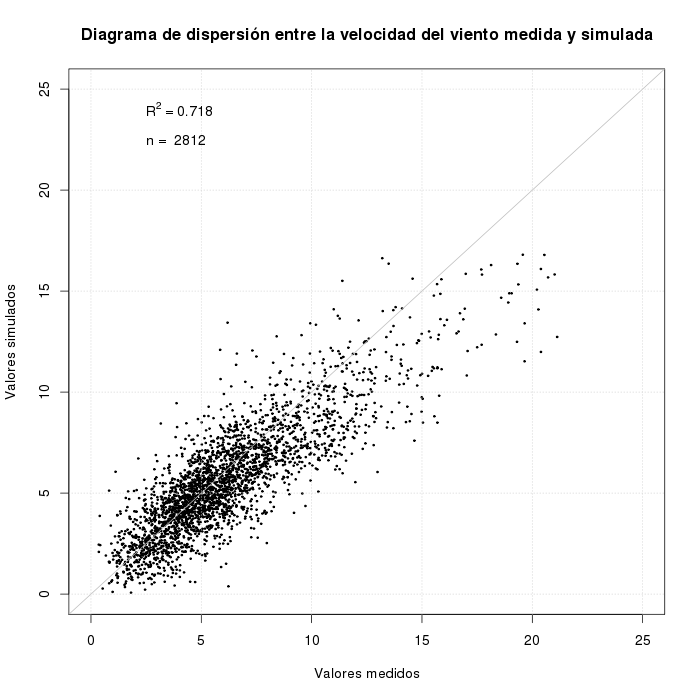 Scatterplot between measured and simulated wind velocity. |
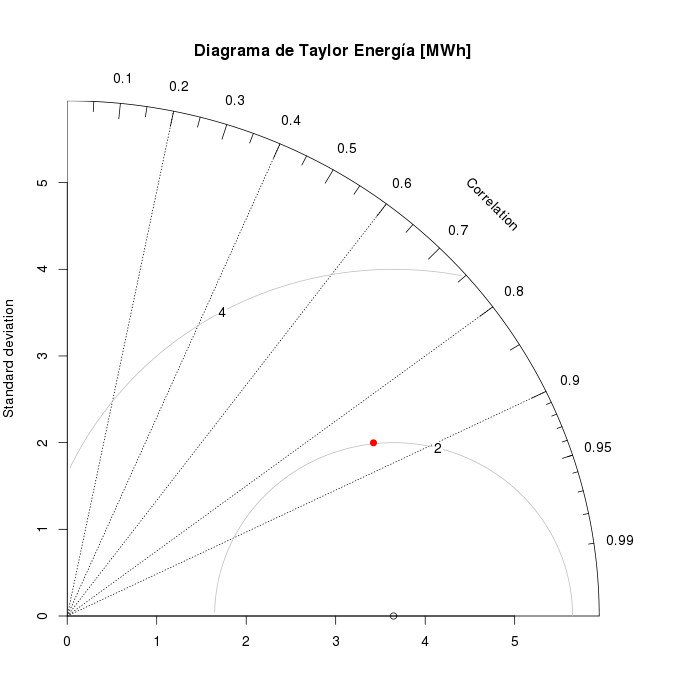 Taylor diagram for measured and simulated hourly energy generation |
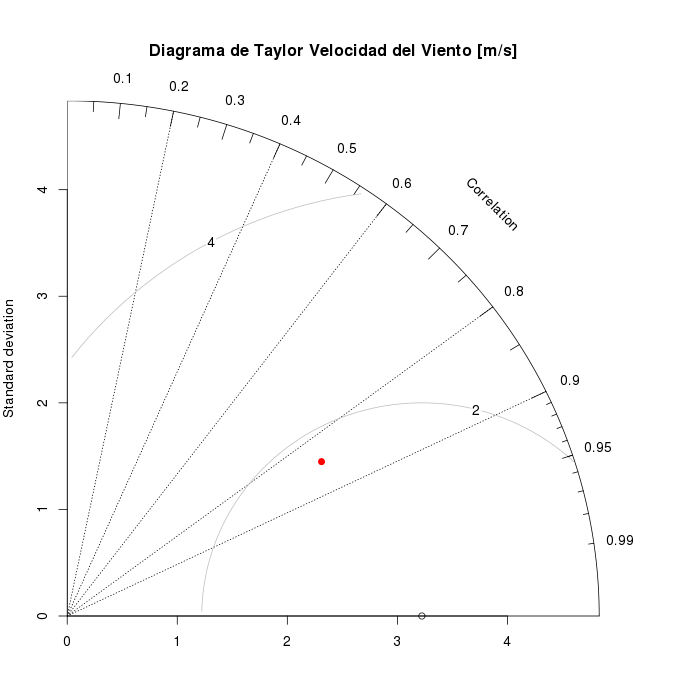 Taylor diagram for measured and simulated wind velocity |
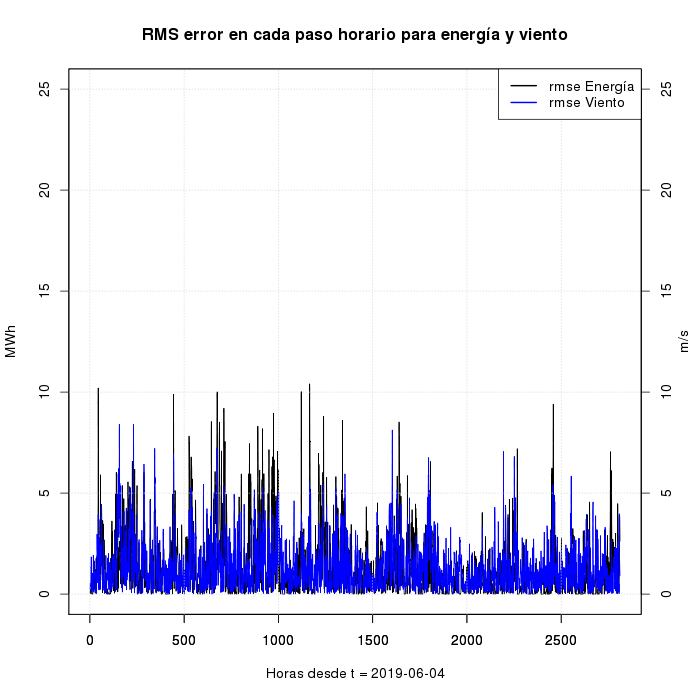 RMSE (root mean square error) for measured and simulated hourly energy generation and wind velocity. |
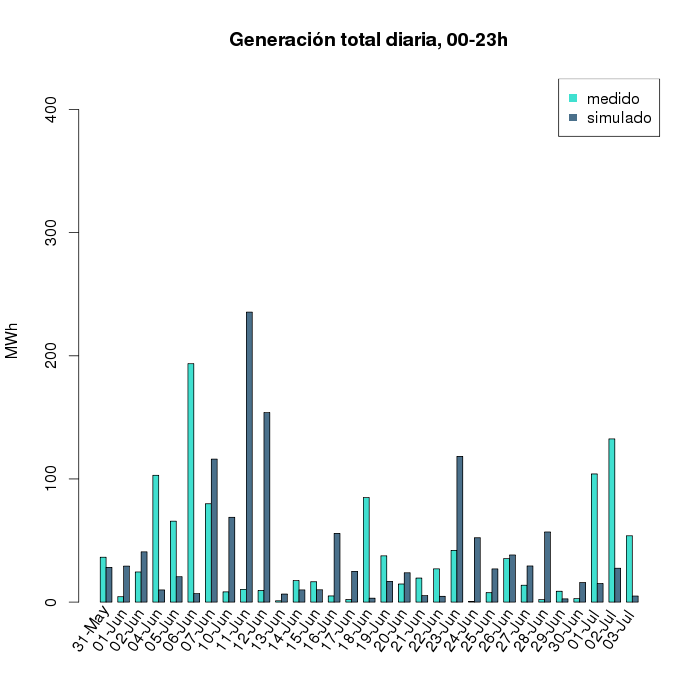 Total daily measured and simulated energy generation. |