Energy

Energy trading and forecasting

Energy trading and forecasting

A continuous, reliable and high density source of energy is essential to keep our civilisation running. However, all energy sources are affected by many variables that are difficult to control, such as geopolitics or weather. Here we present some tools that may help anticipating the impact of weather on sources like solar, wind and hydropower.

Solar radiation

To make modelling solar radiation easier in steep terrain and rough topography, we have developed an series of algorithms to calculate insolation on tilted surfaces. They are implemented in python and R, are freely available for general use and can be downloaded from:

solar rad Gr

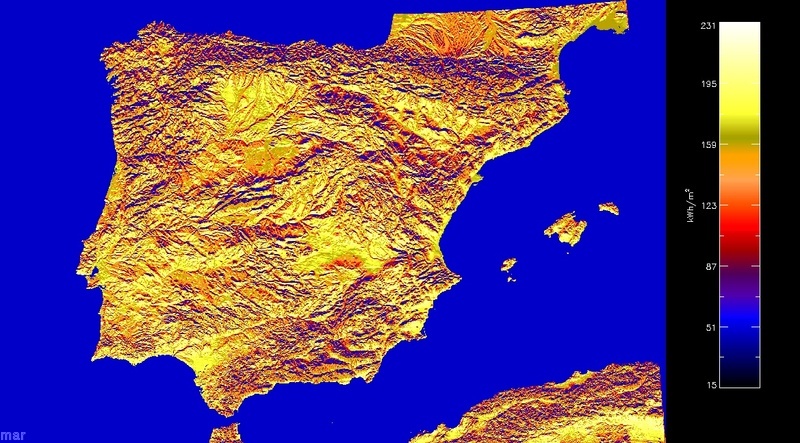
Average monthly mean solar radiation over the Iberian Peninsula in March. Map values are given in kWh/m². Calculation takes into account direct radiation, solar path, atmospheric transmittance, diffuse radiation and shading.

An application of these algorithms is the high resolution map in the following link. You can calculate solar radiation values for any point using the solar calculator below.

Hydropower generation

Hydropower generation is a flexible energy source and a convenient storage of power. It is probably the fastest response to unexpected energy demand or supply shortages, such as when wind power is stalled.

Hydropower exploitation derives its benefit from optimising the balance between the energy costs of pumping and selecting the best time for profitable electricity generation. Therefore, knowing in advance the weather impact can be quite profitable.

We can also calculate hourly water input to basin reservoirs, eg: Corripio & Lopez moreno, 2017

Wind power potential for the UK and the Iberian Peninsula

windpower UK

Daily wind power potential for the UK. Multiply the corresponding value by the nominal power of the wind farm to get the approximate production. Wind power is estimated every hour from a theoretical power curve with 4 m/s cut-in, 25 m/s cut-off and 14-25 m/s rated power. The average is calculated on a site basis, we can calculate it considering the actual installed capacity on every site on demand. Please contact us directly for details.

monthly windpower UK
windpower IB

Daily wind power potential for the Iberian Peninsula. Multiply the corresponding value by the nominal power of the wind farm to get the approximate production. Wind power is estimated every hour from a theoretical power curve with 4 m/s cut-in, 25 m/s cut-off and 14-25 m/s rated power. These are moderate resolution models, for a detailed hourly forecast with better implementation of topography effects, please contact us directly.

monthly windpower IB
Wind IB

Example of wind speed forecast by the WRF-ARW model. Click on the map to access the Wind Power Forecast application.

Wind pow DE

Wind power density (W/m²) maps for Germany. Blue circles are installed plants with diameter proportional to power capacity.

Please contact us for more details and an estimation of costs.