The entrance page is an interactive map with the location of every site. Click on the blue triangles to get the wind forecast at several levels for that site. Inside the tooltip window there is a link for further information.
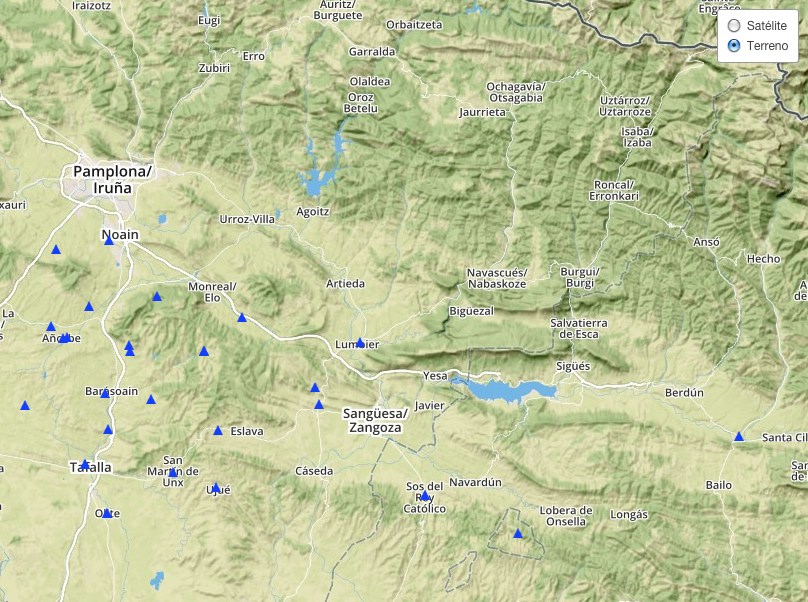
The map can be expanded to full screen by clicking on the symbol  on the upper right corner. The map base layer can be changed from satellite to relieve with the layer selector
  on the upper right hand corner.
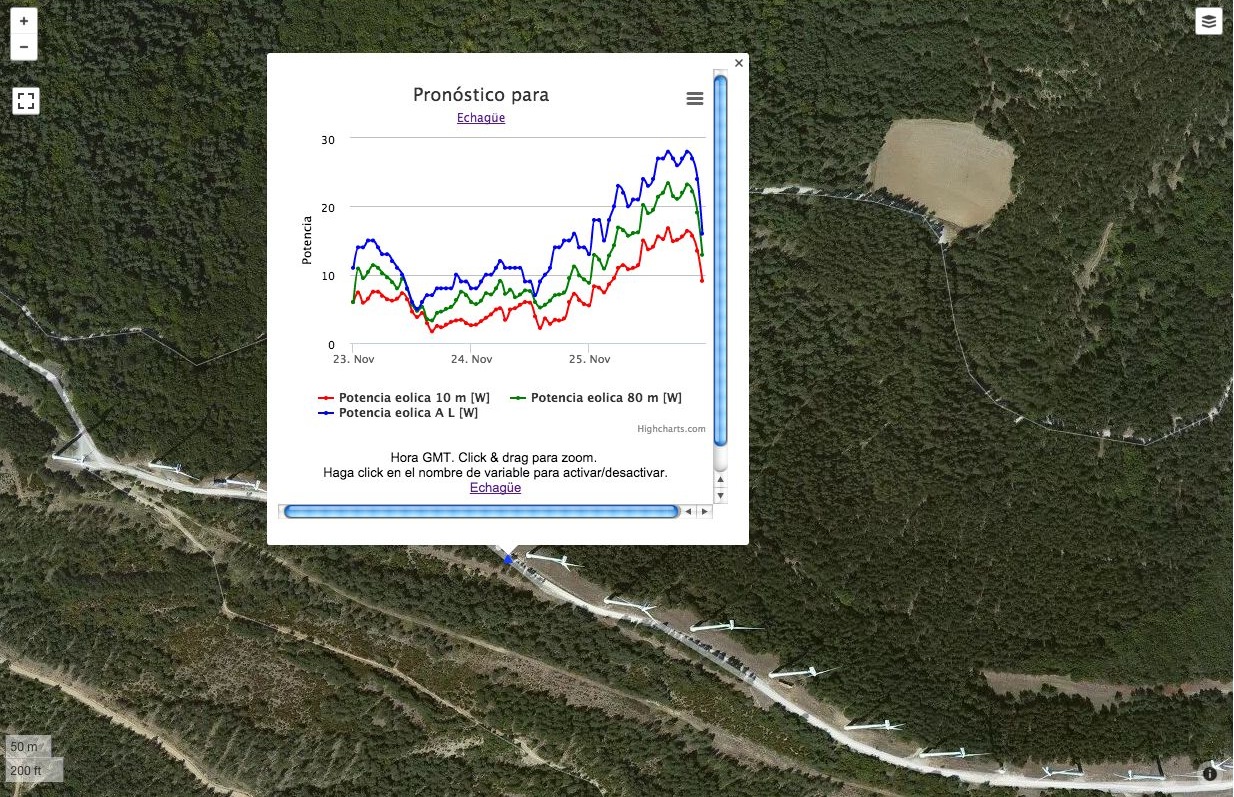
Forecasts are given as an interactive chart showing the output of the WRF model for the next 72 h and for selected variables (Figure 3). Additional charts are given for the GFS model in the "Chart" section of the web site.
Zoom by using controls + - on the upper left corner. You may also zoom by double-clicking on the map.
This section show the data at full temporal resolution for selected variables. It shows both the WRF and GFS outputs in the same page. WRF has a temporal resolution of one hour, while the temporal resolution of GFS is three hours. To compare both models the range of the GFS chart can be adjusting through zooming (click and drag).
Inside this section it is possible to choose any of the sites by region and name using the drop down menus on the upper right side of the page. For faster positioning you can start typing the name of the site.
Generator model can be choosen on the drop down menu above the power chart curve. If you have additional data on your generator, please let us know and we will incorporate them to the database. In the results panel you can choose the number of active generaotrs
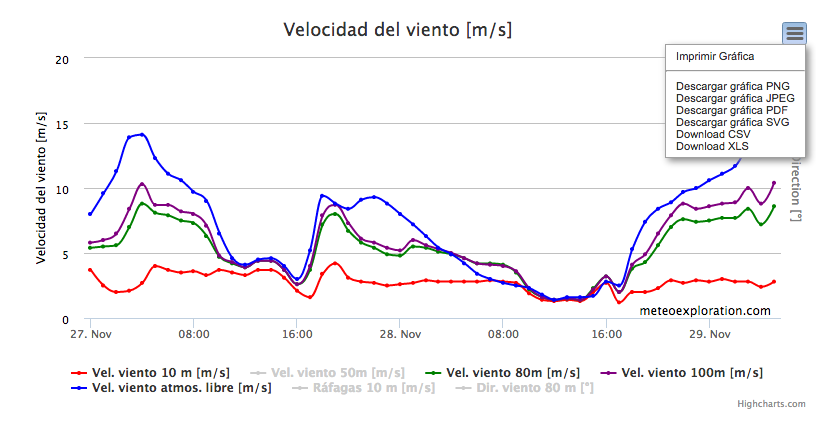
It is possible to zoom on every chart by click and drag. Pressing the control Se puede hacer zoom en cada gráfica mediante "click and drag". Data (csv and xlsx) and figures (diverse formats) can be downloaded by pressing the control on the upper right corner of the chart.
The WRF maps section shows weather charts of different meteorological variables at hourly intervals for the next 72 h. The forecast time can be selected by moving the range slider, on the left side of the page. Charts can be animated by clicking on the animation control.
The GFS maps section shows weather charts of different meteorological variables at 3h interval for the next four days. The forecast time can be selected by moving the range slider, on the left side of the page. Charts can be animated by clicking on the animation control.
To provide a general overview of the situation in the region satellite images from GOES East are provided, these shown the full disk in the visible, infrared and water vapour bands.
If you have any doubt, the information is not clear or if you would like to discuss any additional product, please do not hesitate to contact us.