Charts
Meteogram description
Available panels may change depending on location or weather model.
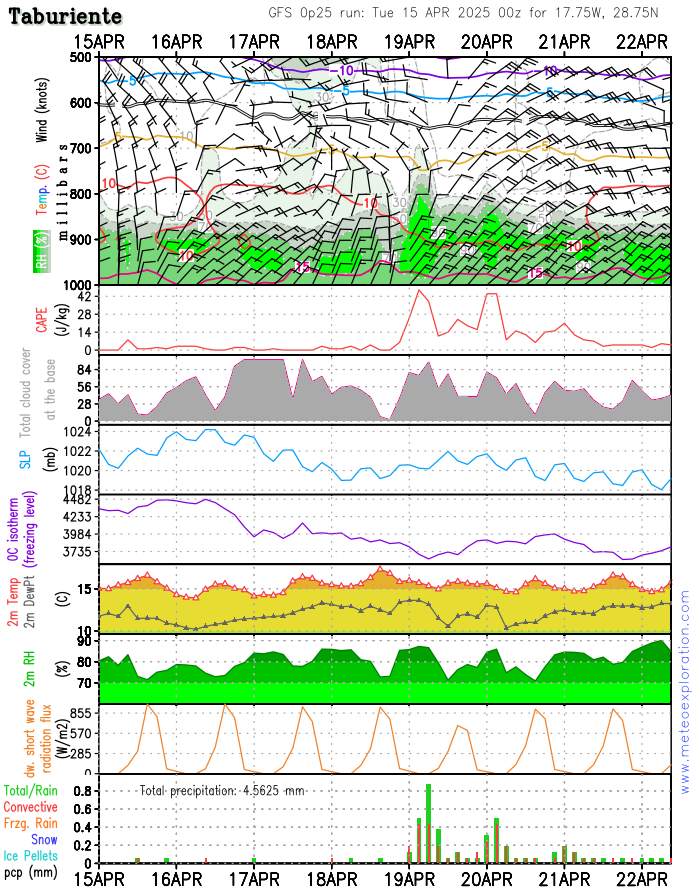
Top panel
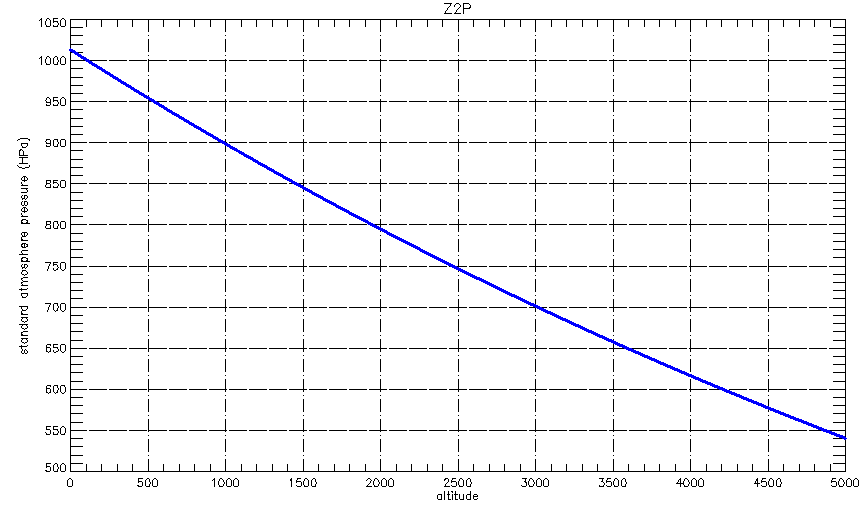
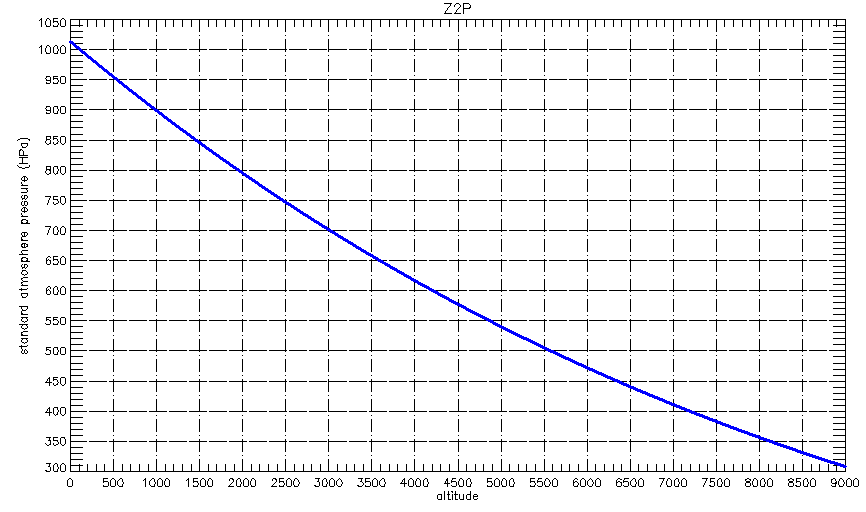
The first panel is a Homvöller of relative humidity with temperature contours and wind barbs. The X-axis is time and the Y-axis is pressure in mb or hPa. To see the equivalence between pressure and altitude for the Standard Atmosphere check the charts at the bottom of the page.
Background colour is relative humidity (RH) from white (0%) to grey to green (100%). High relative humidity values (over 90%) might indicate condensation, and therefore cloud formation, fog and likely snow or rain.
Colour contours indicate air temperature (°C). The 0°C isotherm is highlighted, which helps forecasting snow level. It is worth remembering that it can snow at higher temperatures, depending on relative humidity and temperature profile aloft. These contours, together with wind speed and direction can give a rough idea of air masses and fronts displacement.
Wind barbs indicate wind speed and direction. Convention is 10 knots per barb, 5 knots half a barb and 50 knots per triangle. For example, wind coming from the Northwest at 60 knots: ![]() ; or wind from the SW at 25 knots:
; or wind from the SW at 25 knots: ![]() .
.
CAPE Convective Available Potential Energy
CAPE is the maximum buoyant energy available to an ascending parcel of air. It is a measure of atmospheric instability, with high numbers indicating possible convective activity (and therefore thunderstorms)
TCC Total Cloud Cover
The amount of cloud cover, 100% means completely overcast, 0% completely clear. The GFS model seems to overestimate the total cloud cover. Check the solar irradiation panel for a better estimate.
1000 - 500 mb thickness
The 1000 - 500 mb thickness is the height difference between the 1000 mb level and the 500 mb level, measured in decameters (10 m). As air expands with heat, a smaller thickness means colder air in between. A practical rule of thumb is that precipitation on the ground is usually as snow if the thickness is smaller tan 540 (loosely, 50% of the time will snow below 300 m at thickness = 540 Dm).
SLP Sea Level Pressure
This is obtained by the theoretical reduction of the barometric pressure to sea level. If ground level is above sea level, it shows the extrapolated pressure to sea level. It is probably the most familiar figure in weather charts, low pressure is usually associated to unstable weather conditions while a high pressure indicates stability.
Wind speed at 10 m
This is the estimated wind speed at 10 m above ground surface. The GFS model has a resolution of 0.25°, or approximately 27 km (depending on latitude). At this resolution the terrain is smoothed and ground level may not correspont to actual ground level at a given point. If model is WRF terrain is more realistic. Wind barbs indicate wind speed and direction as explained before.
Temperature and dew point temperature at 2 m
Air temperature and dew point at 2 m above ground level (see above comment on model resolution). Dew point is the temperature to which air must be cooled in order to reach saturation. The closer the dew point to the air temperature the higher the relative humidity, if they are equal it means saturated air.
Relative Humidity at 2 m
Relative humidity at 2 m above ground level. 100% indicates saturation and therefore likely condensation, fog, clouds or rime.
Short wave irradiation at surface
This is useful to check wether is cloudy or clear and gives a better idea of cloud thickness than the total cloud cover chart. An approximate idea of the thickness of cloud cover can be estimated by comparison with clear skies irradiation values in the chart below. The chart is calculated at 1000m a.s.l. for the European spots and at 5000m a.s.l. for the Everest

Precipitación
Indicates type and amount of accumulated precipitation over the last time period. Note that precipitation smaller than 1mm/6h is normally unreliable. Precipitation amount is always given at the base of the mountain (the height of the grid cell point). Individual forecasts are estimated for the summit conditions.
Total / Rain
Convective precipitation
Freezing rain
Snow
Ice pellets
Pressure - altitude equivalence for the Standard Atmosphere